Watching Hunga Tonga from Seattle
The recent major undersea volcanic eruption off Tonga was detectable around the world. People heard it in Alaska, tidal rivers ran upstream in Canada, and so on. The blast was also picked up as fluctuations in barometric pressure around the world. The atmospheric shock wave would have traveled at the speed[s] of sound as it rippled out in all directions, circling the globe at least twice and doubtless interfering with itself and with weather conditions in complicated ways.
The community of WeeWX weather software users began reporting that their home weather stations were registering the volcano's effects. I checked mine without finding anything in the default pressure plot, which had already scrolled past the Saturday event, so I dumped the SQLite database and made a higher-resolution plot of my own.
Note |
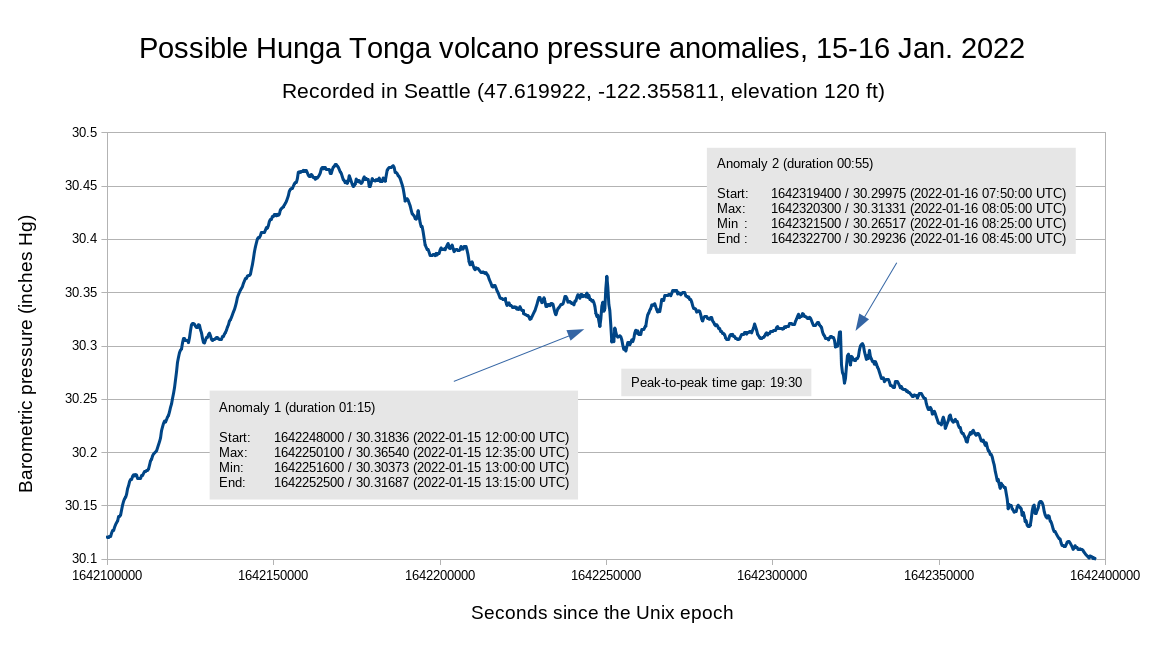
The big blast started at 04:14:45 UTC on 15 January, so it took 07:45 to get to Seattle and produce Anomaly 1. Google Maps gives the distance from Hunga Tonga to my house as 5740 miles (rounding to three significant figures, which I do throughout). Wikipedia has various things to say about the speed of sound, and I initially used the value of 767 mph before reading the fine print and understanding how much altitude and other considerations affect the speed. Quick and dirty, I calculated what the distance should be based on the speed of sound and the time it took to register on my device:
7.75 hr ⨯ 767 miles/hr = 5940 miles
This is at least in the ballpark of Google's 5740, so I assumed from this that Anomaly 1 represents the blast.
Anomaly 2 occurs 19:30 hours after Anomaly 1. I first envisioned the shockwave as travelling on around the globe and eventually returning to Seattle, a 24,900 mile trip. Under this assumption, the starting time would be the same as the Anomaly 1 arrival time, so the calculation was
19.5 hr ⨯ 767 miles/hr = 15,000 miles (rounding)
This seemed way off. Then I realized that the next shockwave would more likely have come from the opposite direction. I could calculate this secondary (and longer) great-circle route easily, and the starting time would be the time of the blast itself at 04:14:45 UTC with a measured delay of 27:45.
(24,900 - 5740 miles) ÷ 767 miles/hr = 25 hours
This is a much better match. The approximate timing matches and the similar pressure fluctuation signatures argue for these two anomalies being volcano-related.
I performed the same analysis using a weather station graph from Stuttgart that was briefly included in Wikipedia's article 2022 Hunga Tonga eruption and tsunami. It closely resembled my own two-pulse plot and the plots of several contributors to the WeeWX discussion list.
.svg.png)
Investigation into global geography on Google Maps showed that ... surprise! ... the shorter great-circle route to Stuttgart passes over the north pole and down from Scandinavia, at 10,300 miles. The route leading to the second bump, with a longer delay, is the one that traverses the Western Hemisphere.
The following table compares all four of these pressure events, ordered by distance. The Relative error calculations indicate the percentage of deviation between the measured distances (courtesy of Google Maps) and the calculated distances (based on observed anomaly times and a guess at the speed of sound). For easier comparisons, I used a time difference calculator to convert hour:minute times to minutes.
| Anomaly | Measured distance (miles) | Measured delay (hr:min) | Measured delay (min) | Calculated delay (min) | Relative error |
| Seattle 1 | 5740 | 7:45 | 465 | 478 | 2.8% |
| Stuttgart 1 | 10300 | 15:00 | 900 | 858 | 4.9% |
| Stuttgart 2 | 14600 | 21:03 | 1263 | 1217 | 3.8% |
| Seattle 2 | 19160 | 27:45 | 1655 | 1597 | 3.7% |
| Speed of sound = 767 mph = 12.8 miles/min ----------------------> Best fit: |
12.0 | ||||
All of the observed and calculated times match up nicely, especially after playing around with the speed-of-sound value. I deviated from the original 767 mph (12.8 miles/minute) figure when I saw by experiment that it improved the observation/calculation matches, while remaining fully within expected variation of the speed of sound at different altitudes and temperatures. I'm not sure what to do about altitude, and the temperature may well have varied among the data points, but 12 miles/minute fits perfectly with -15° C. based on the National Weather Service's Speed of Sound Calculator.